My husband, who shares my love of technology and history, pointed out a recent Los Angeles Times article on the sleigh bell industry. The article focused on the Bevin Bros., a Connecticut-based company that has been making sleigh bells since 1832.
I was most intrigued by the paragraph on how the industry grew in the 19th century. Sleigh runners were nearly silent and glided quietly along the snow. Many states passed laws requiring harness bells to announce the approach of sleighs to pedestrians and others.
Maybe we need them on Priuses? Then, the bells became associated with Christmas due to James Lord Pierpoint’s “The One Horse Open Sleigh” in 1857 (link to Library of Congress copy), which became “Jingle Bells” two years later.
As a socio-technology fan, I am intrigued by the morphing of holiday cards and letters with new technologies. This, of course, has been changing for quite a few years. Desktoppublishing has brought us pictures of our
lives within cards and letters for a while now. They almost are like the old portrait paintings, where you were pictured with your favorite objects that described to the future who you were by the things you liked. Here, we have pictures with kids and musical instruments, families on trips, and all the trappings of “who we are” in evidenced pictures.
Holiday greetings of the past
This year, I began to get holiday digital cards around Hanukkah from my Jewish friends, which became the harbinger of the full holiday season to come. I got a lovely anime self-portrait by one of the daughters of one of my long-time friends, superimposed on their home. Charming and original – and very current tech.
Then came the deluge of emailed jpgs to my business email from a swath of companies that I’ve never done business with, reminding me that they are thoughtful and cool this time of year. Who are these companies? What did they think I would do in getting their email? “Boy, I really did need that mailing list service — I should give them a call?”
Now, as we get closer to Christmas, Iam getting all of the digitized photo cards. In the recent past, creative- and technology-focused friends have created marvelous montages and nearly homemade lovelies that were a mash up of design and digital photography. This year, other friends seem to have found companies to do this for them. LOVELY choices, but an intriguing mix of the holiday card and letter, with professional services mixed in.
Here’s my headscratcher of the season: two nag holiday letters. Two female holiday letter-writers (who shall remain nameless) took the opportunity of their holiday letter to gripe at their husbands through the text.
Is this a strange reflection of the gender bias in the role of holiday card creator? In my family and in many of the families I know, the wife in a duo is socially expected to create the card, update the list, add the handwritten notes, and get the darned things mailed out. She, in essence, becomes the family narrator. Here, two lovely ladies have taken that narration to a deeper level, providing (not flattering) holiday context to the letter.Power grab? Acting out? Attempting to add humor? All three? 🙂
I had thought it to be a Facebook status warping of a non-Facebook medium, but then realized that neither of the women are active Facebook users.However, has Facebook and all of this constant update dialog changed the nature of the holiday letter? For many people, I know a lot of this information about them already from their posts and photos uploaded.
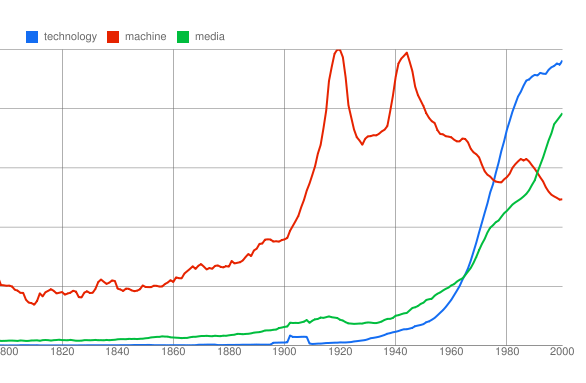
I have been playing with things like searching for the word “technology” and comparing it to the history noted in Kevin Kelly’s What Technology Wants book, where he notes how recent technology is as a social phrase. Intriguing!
Who’s in School: I spent some time tinkering with the selectable visualization tool on demographics of U.S. undergraduates from The Chronicle of Higher Education: http://chronicle.com/article/Who-Are-the-Undergraduates-/123916/. This reminds me of many aspects of U.S. education, including that most college students are white and in 2 year programs. I also was fascinated by the comments, which included how obvious some of this was to some people (and not others).
Rumors and Alternatives: I also spent some time yesterday finding alternatives to Delicious, a social bookmarking tool. The rumor of the demise of Delicious, which has been part of my own life since 2006. Various articles and shout outs from competitors have arisen quickly. I have been trying Licorize, Evernote, YourVersion, and Diigo as imports of my data. I have exported all of my bookmarks for future alternatives that may surface.
Download or buy?: Dan Gillmor’s new book, Mediactive, is now available online and for purchase. I did the download, I sheepishly comment, and will be reading it this coming week.
I have been watching the public dance about KCET and PBS squaring off about tithing rates for programming. This tension challenges some of KCET’s biggest assets: goodwill and cross-promoted programming brands. KCET’s potential future as an independent station changes everything: cost structure, programming, audience, donor support, etc. This transition also can allow it, however, to start fresh.
If you were going to start anew with a local television station in this current digital era, what would you build?
Real online/offline community engagement?
Partnerships with local colleges for a marvelous science show?
Partnerships with local arts organizations to cover Los Angeles arts, including in-depth bios and community engagements?
Partnerships with local newspapers for marvelous public affairs shows?
Engaging with the donor community more actively participate with the brand?
Finding the best of other cities’ local content?
Picking up good next-level down kids’ branded content?
Breaking away from the over 65 and under 5 crowd and program for another audience?
What is the face of the new brand? How would you quickly have to change your organization’s strengths? How do you build new local brands and personalities? How do you syndicate this production, or do you and to whom?
If you aren’t Sesame Street, McNeil Lehrer News Hour, Frontline, what are you?
Their website’s “Ask Al” discussion with the CEO (http://www.kcet.org/about/ask-al/ask-al-kcet-goes-independent.html) is filled with responses that are very negative with a few hurrays that someone finally might program for the real Southern California community. Perhaps the opportunity here is to break KCET away from this narrow set of expectations and very narrow demographic to build the next generation public television station for the local community?
The challenge is . . . what will that be? And how will the station make the short- and long- term organizational changes to run it, market it, and thrive?
As some of you know, I’m fairly anti-PowerPoint. Done well with engaging pictures and messaging, it can be a fabulous medium. Used by most people, it is a grinding parade of bullet points, read-aloud slides, and missed interactive thought. Presentations aren’t locked to a 11×8-1/2 inch format with a heading on top, disconnected bullet points, and canned charts. But if you don’t know more is possible or your company bows down to PowerPoint, you may have been stuck.
Data visualization is not new and has been embraced by many companies around the cutting edge, but hasn’t reached the organizational presentation mainstream. I’m meandering through many tools right now to find the right method for visualizing a complex series of research outcomes to a group of individuals. Here are some visual metaphors and tools that might add to your working vocabulary:
Webspiration: Currently in a public beta under Mywebspiration.com, this tool strikes my current fancy among the many Concept Map tools. I also like VUE and others, but I’ve been using Inspiration for two years and enjoy the interface. This app takes it on the road for collaboration and integration into group process. Very cool. http://mywebspiration.com/
DebateGraph: I had missed this when CNN had embraced it to “locate” debate with visual graphs and metaphors and am fascinated by it. http://debategraph.org/Stream.aspx?mID=1243
Prezi: Very visual storytelling with a very different set of metaphors than PowerPoint. Imagine your presentation world as a GIGANTIC whiteboard and your presentation metaphor as a lens that can zoom in, pull back, and swirl around the board. You can present it on the fly or automate your lens patterns. http://prezi.com
Brainshark: One of my business-to-business sales friends swears by this. You can “can” your presentation and have it present for you with private links. http://presentation.brainshark.com/
TechSmith’s Camtasia: I adore Camtasia in how I can capture screen images, do call outs, etc., record my webcam, and package a full presentation with easy editing. While I was traveling in China back in the Spring, I Camtasia’d my course introduction and even a daily pre-test with this tool. For simple video editing, I find it very crisp and clean. This isn’t free, but worth every penny (especially at the educator or student price, of course). http://www.techsmith.com/camtasia.asp.
Soytuaire still charms me and made Time Magazine’s 50 best websites of 2010 in August. It breaks the visual metaphor for Flash video in rolling sideways and allowing tactile interaction through your mouse to change the “flow.” http://www.soytuaire.labuat.com
TriVergence: And lastly, I would be remiss if I didn’t mention Dr. George Geis’ TriVergence. I watched yet another group of executives drop their jaws when he used it this summer to show the timeline-based succession of acquisitions by Apple in the music business. For a decade or so, he has been gathering data and visually mapping an amazing number of M&A deals in media, communications, and technology sectors into this user-friendly tool. It isn’t as sexy as some of these above, but holds key data in a communication-friendly form. http://www.trivergence.com/
I know this is just the tip of the iceberg. I could go on at length (and may later) about tag clouds (e.g., visualizing the Twitter data streams on Twitscoop), word sculptures (e.g. Wordle, or more at the ), and other data visualization tools (e.g. more at IBM Visualization Lab…http://vizlab.nytimes.com/visualizations). I’ll stop here for now, but please feel free to comment or email me at gigi [at] maremel.com with other suggestions and recommendations.